Every time I wanted to know something about my blog traffic — which article did well, where readers came from, whether a post got any traction — the answer was the same: open Athena, remember the table schema, write a query, and wait for the answer. For a personal blog I check maybe once a week, that friction was enough to make me not bother.
I wanted to just ask the question.
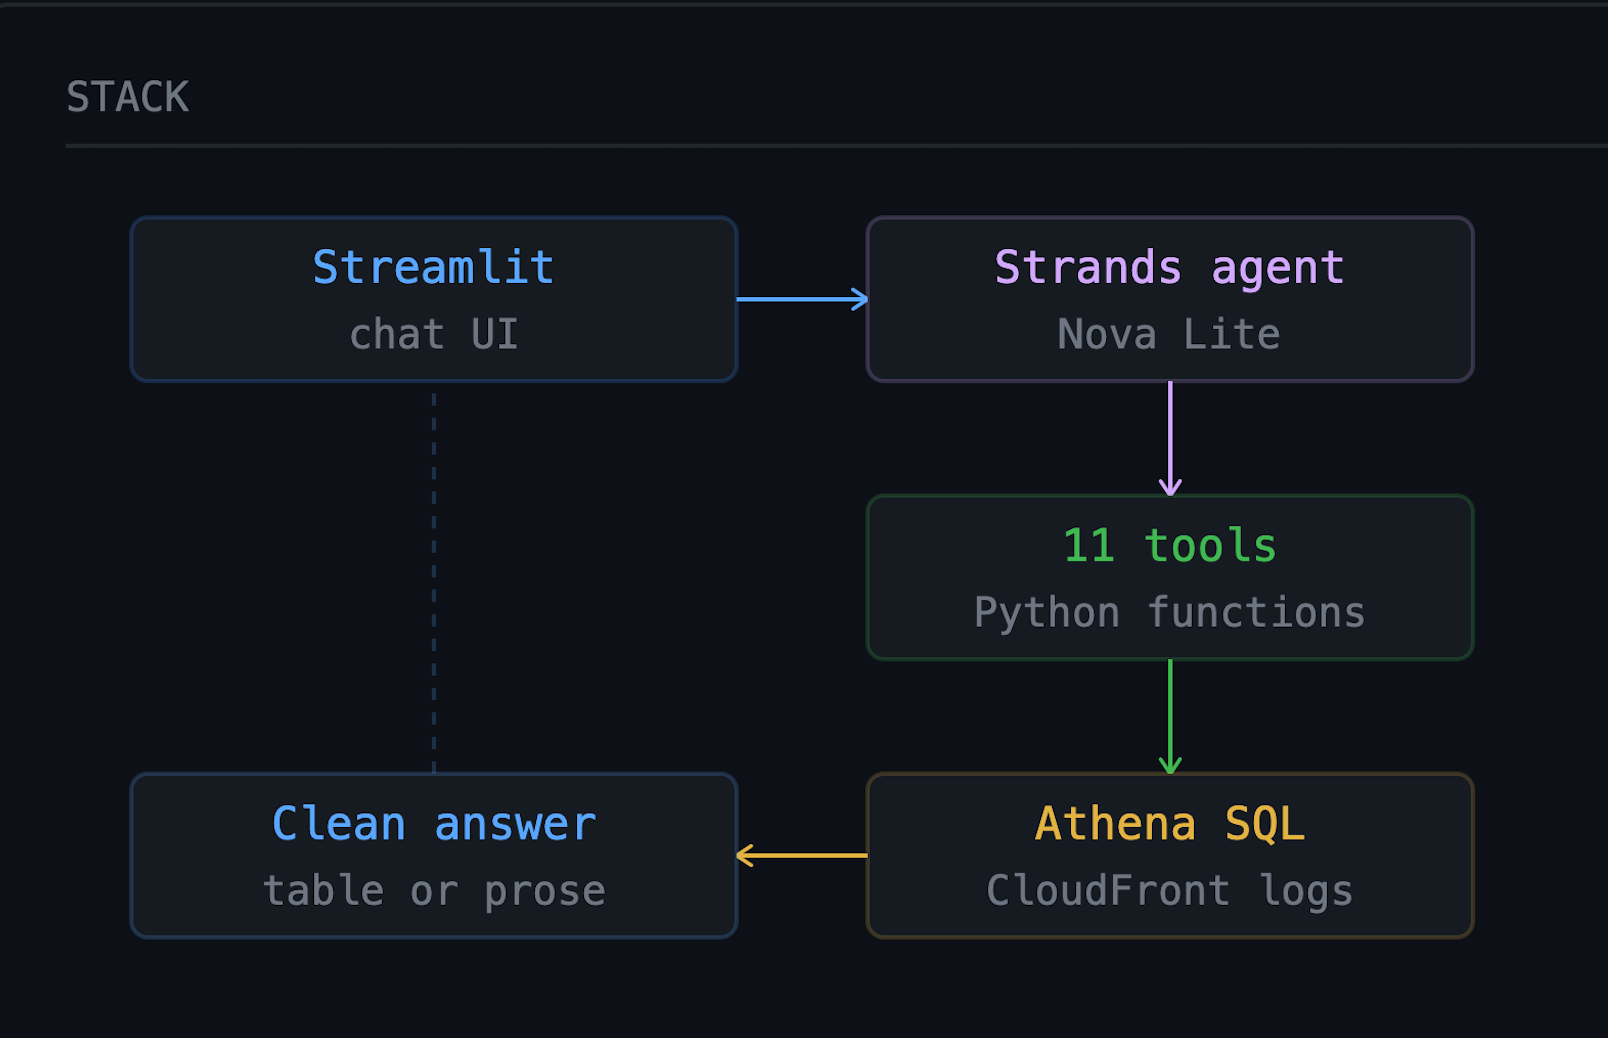
So I built a small observability agent for sreevamsi.dev using AWS Strands, Amazon Bedrock, and Athena. It routes natural language questions through a focused set of tools, runs the right SQL against my CloudFront logs, and returns a clean answer. This post documents what I built, the decisions I made along the way, and a few things I’d do differently.
What This Project Does
The result is a lightweight observability interface for my blog, with Streamlit for the UI and Amazon Bedrock (Nova Lite) for the agent. It is designed around two kinds of tools: standard analytics that complement the CloudFront dashboard, and reader behaviour queries that CloudFront simply cannot answer.
Standard analytics (with bot and scanner filtering):
- referrer breakdowns
- 4xx error analysis scoped to real paths
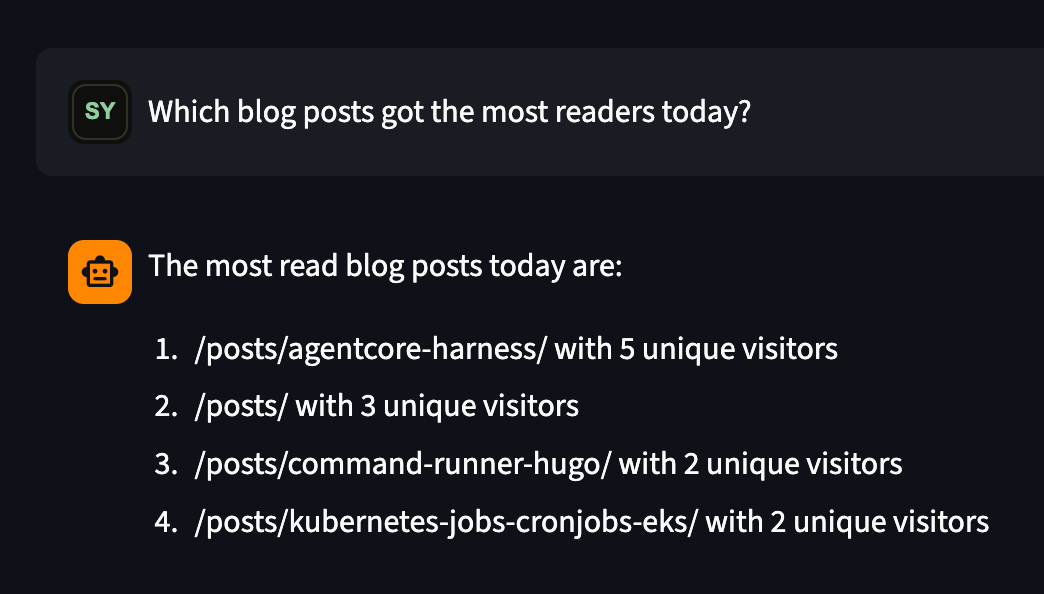
- top article analysis by unique visitors
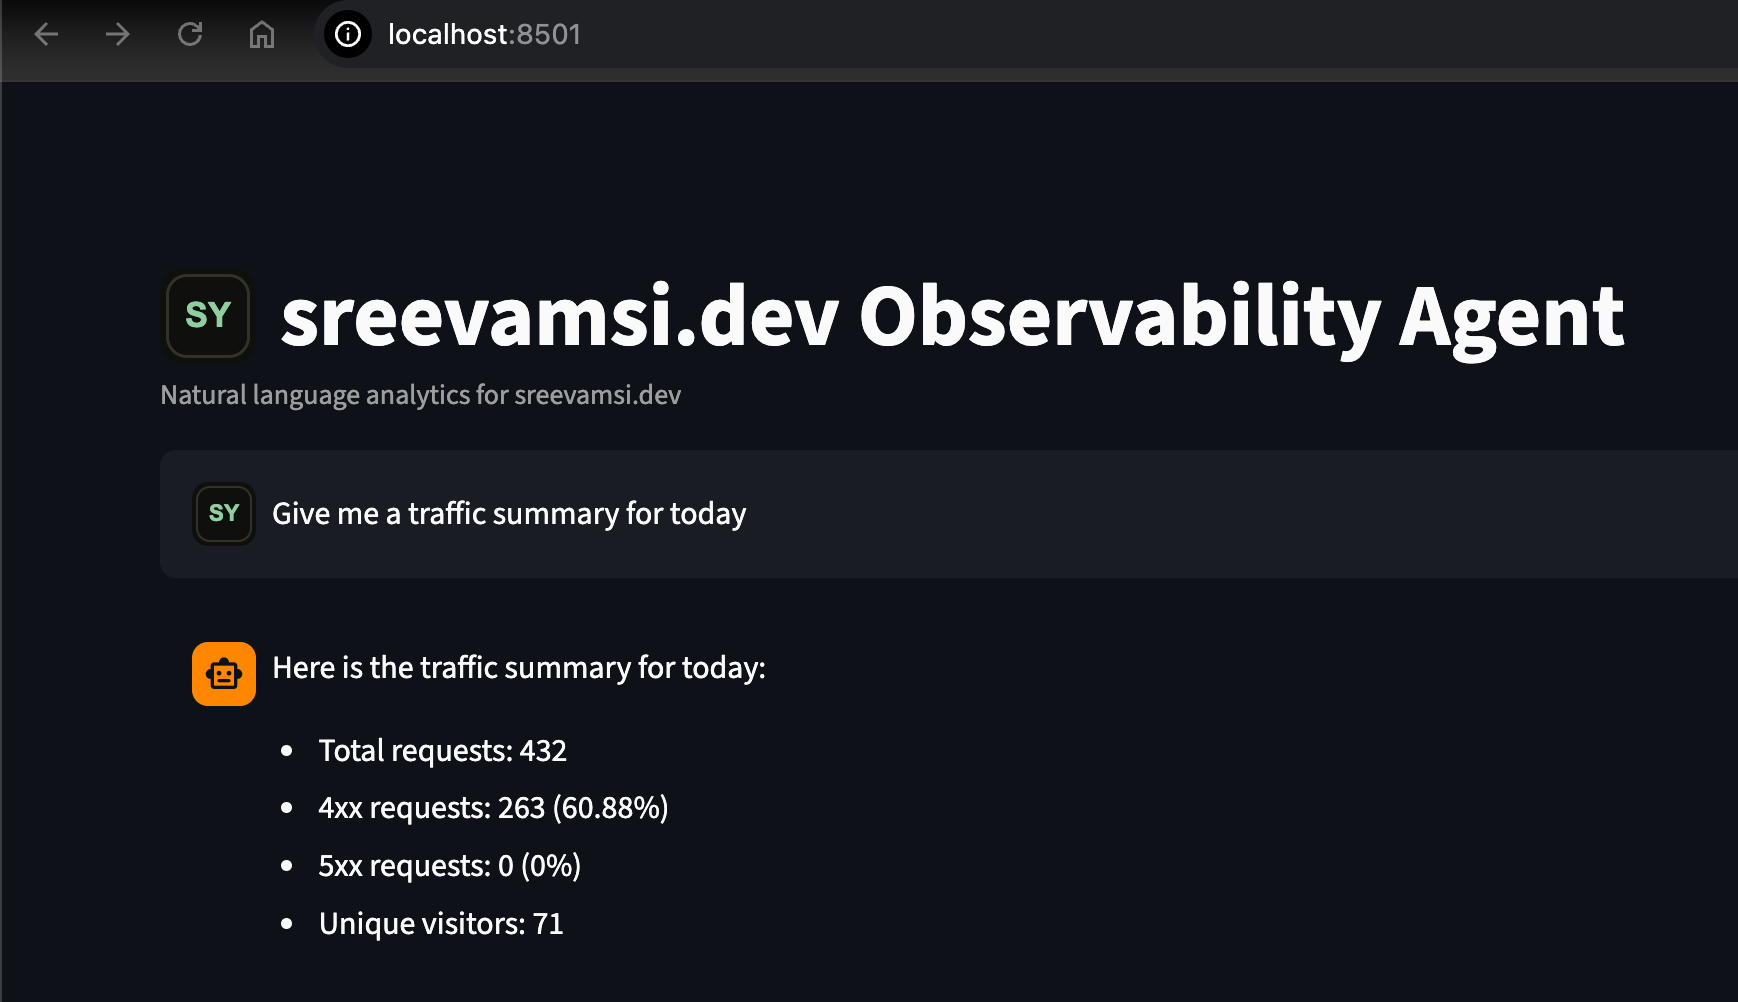
- traffic metrics summary
- geo-location analysis by country and city
- visitors to a specific page
Reader behaviour — unique to this agent:
- multi-article reader retention (who read more than one post?)
- hourly traffic patterns (when do real readers actually visit?)
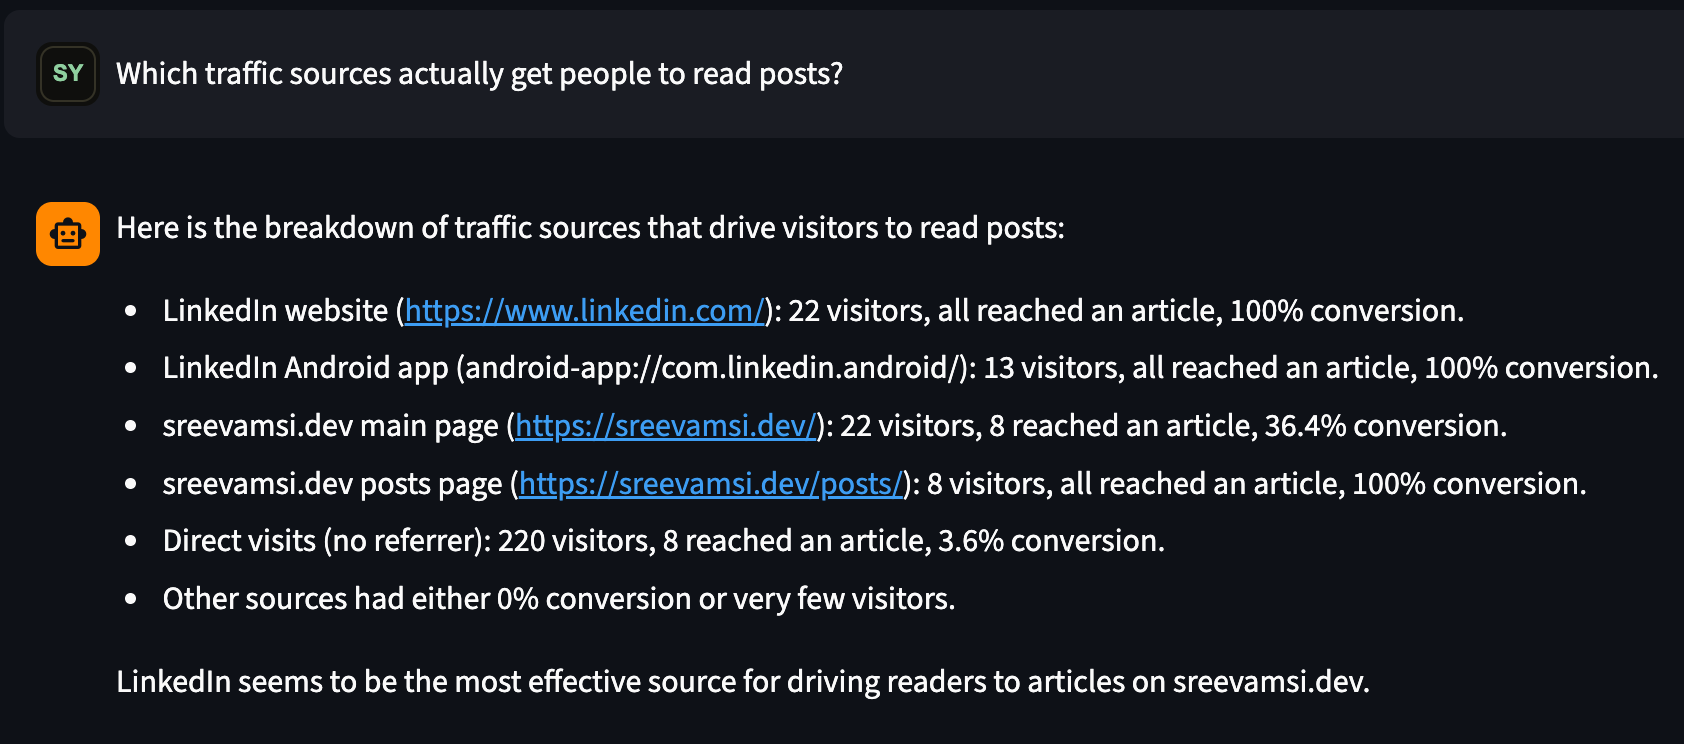
- referrer-to-article conversion (which sources drive readers vs bouncers?)
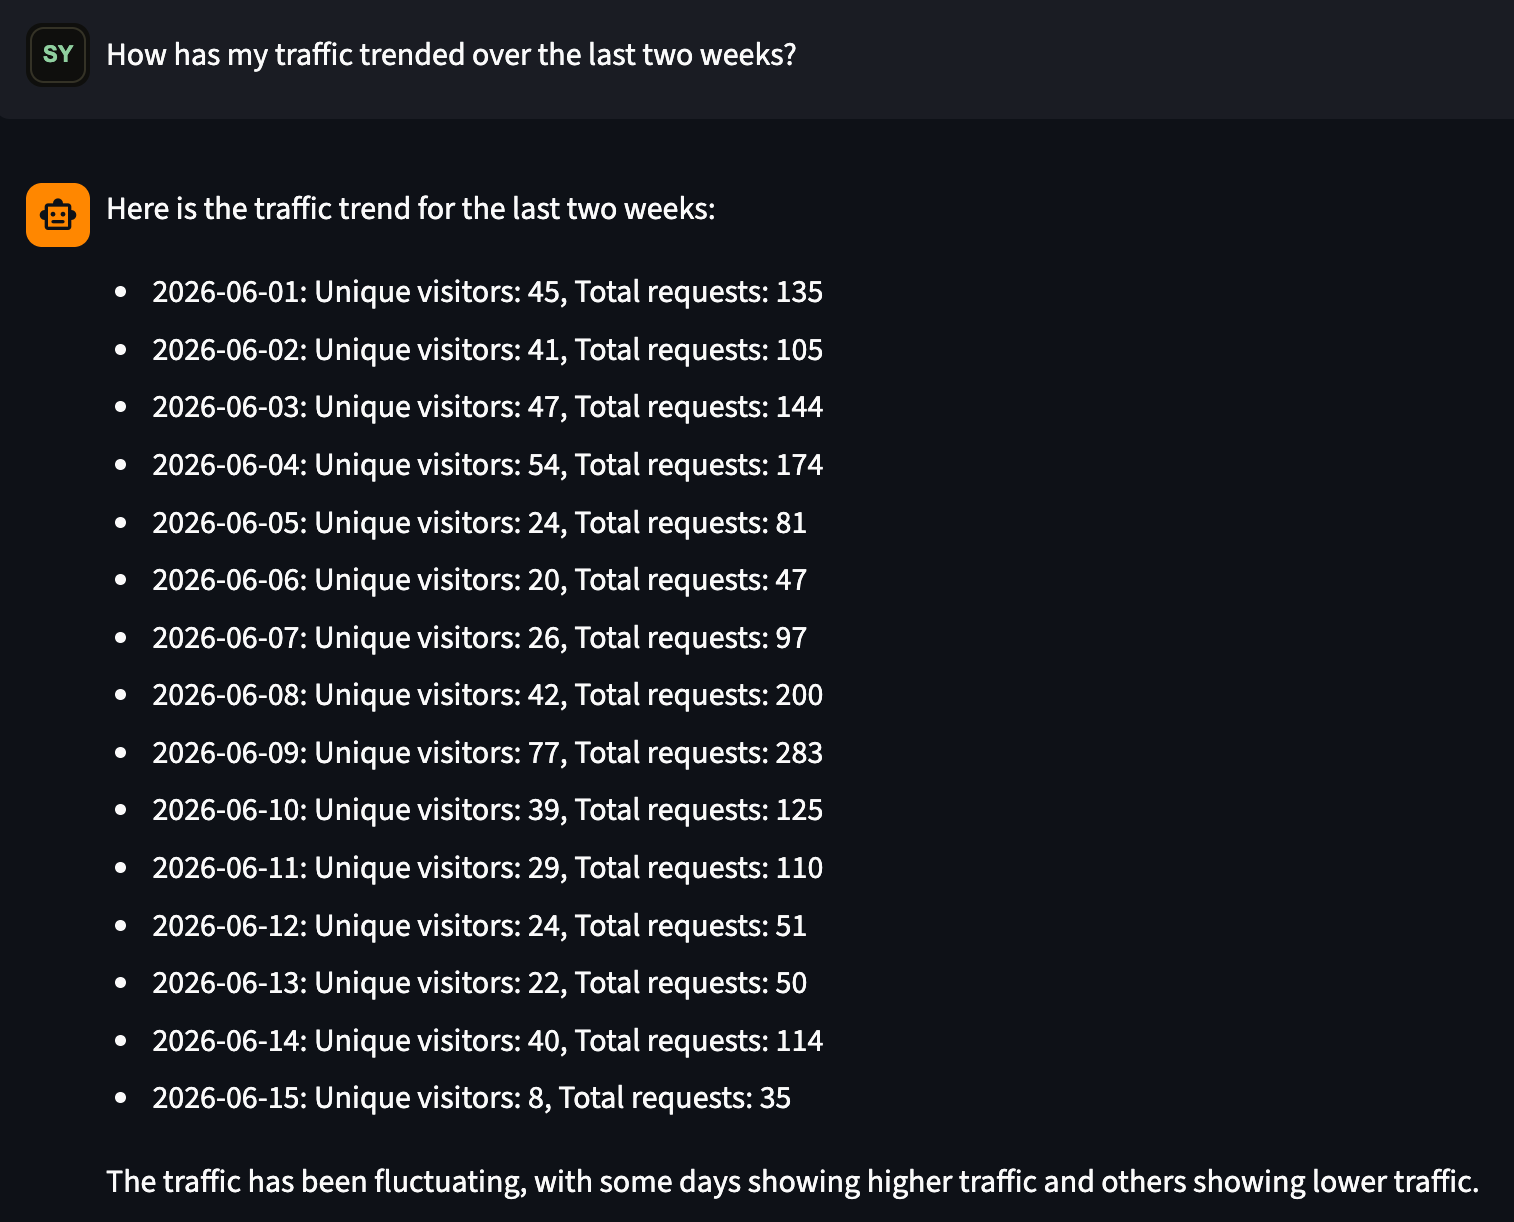
- day-over-day visitor trend over 14 days
- new vs returning visitors
A Few Screenshots
Traffic metrics summary
Top articles
Referrer to article conversion
Day-over-day visitor trend
Architecture
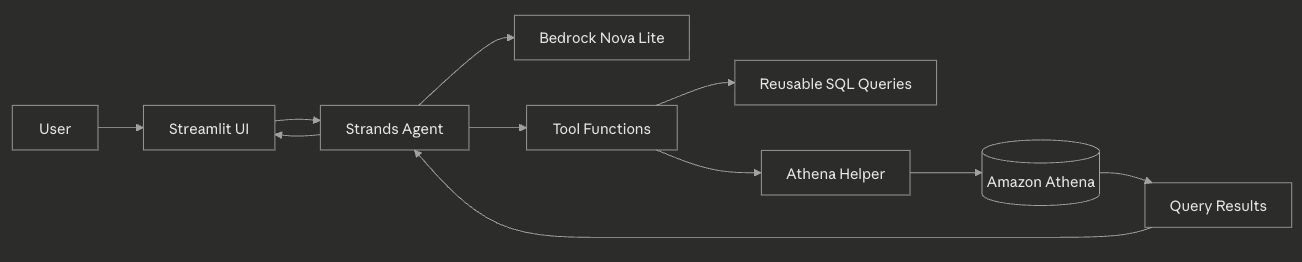
The project is intentionally small and easy to reason about.
Request flow
- A user enters a question in the Streamlit chat input.
app.pycreates a fresh agent instance for the request.- The agent decides whether a tool is needed.
- Tool functions call reusable SQL strings from
queries.py. tools/athena.pysubmits the SQL to Athena and waits for results.- The response is returned to the agent and rendered in Streamlit.
Why this structure works
- The UI stays thin and focused on presentation.
- Queries remain centralized and easy to update.
- The agent layer owns tool selection and response generation.
- Athena execution is isolated in one helper module.
Folder Structure
observability-agent/
├── app.py
├── main.py
├── queries.py
├── requirements.txt
├── agents/
│   └── blog_observability_agent.py
├── models/
│   └── nova.py
└── tools/
    └── athena.py
File Guide
app.py
The Streamlit frontend. It:
- sets the page title and favicon
- renders the header
- stores conversation state in
st.session_state - accepts chat input
- creates the agent
- displays responses and errors
from agents.blog_observability_agent import create_agent

question = st.chat_input("Ask something like: Which articles got the most readers today?")

if question:
    st.session_state.messages.append({"role": "user", "content": question})

    with st.chat_message("assistant"):
        agent = create_agent()
        response = agent(question)
        response_text = clean_response(str(response))
        render_response(response_text)
render_response inspects the agent’s output for an embedded JSON array. Multi-row results render as a st.dataframe; single-row results (like traffic_metrics) render as metric cards; everything else falls back to markdown.
agents/blog_observability_agent.py
The agent definition. It contains:
- the
SYSTEM_PROMPT - tool functions for each capability
- the
create_agent()factory
This is the orchestration layer that connects Bedrock, tools, and the application. Each tool is a thin wrapper that pulls the right SQL from queries.py and hands it to the Athena helper. The page_visitors tool is parameterized — it accepts a URI stem that gets interpolated into the SQL before execution.
from strands import Agent
from strands.tools import tool

from models.nova import model
from tools.athena import run_athena_query
from queries import QUERY_MAP

@tool
def reader_retention():
    """
    Show visitors who read more than one article in the last 7 days.
    """
    return run_athena_query(QUERY_MAP["reader_retention"])

@tool
def page_visitors(page: str):
    """
    Show which IPs visited a specific page in the last 7 days, excluding bots.
    """
    sql = QUERY_MAP["page_visitors"].format(page=page)
    return run_athena_query(sql)

def create_agent():
    return Agent(
        model=model,
        system_prompt=SYSTEM_PROMPT,
        tools=[
            top_referrers,
            top_4xx_errors,
            top_articles,
            traffic_metrics,
            geo_location_analysis,
            page_visitors,
            reader_retention,
            hourly_traffic_pattern,
            referrer_to_article_conversion,
            daily_visitor_trend,
            new_vs_returning,
        ],
    )
This pattern keeps each capability explicit and easy to extend. The agent picks from a curated set of tools instead of generating arbitrary SQL at runtime.
queries.py
The SQL library for the project. Each query is stored as a reusable string and exposed through QUERY_MAP.
A key design choice here is the BOT_FILTER — a block of LOWER(cs_user_agent) NOT LIKE conditions covering Googlebot, Bingbot, Yandex, Semrush, Ahrefs, social media crawlers, and others. Every query inlines this filter via an f-string, so there is one place to update when new crawlers show up.
BOT_FILTER = """
    LOWER(cs_user_agent) NOT LIKE '%bot%'
    AND LOWER(cs_user_agent) NOT LIKE '%crawler%'
    AND LOWER(cs_user_agent) NOT LIKE '%spider%'
    ...
"""
Queries that need runtime values — like page_visitors — use .format() for interpolation. The template uses escaped braces {{page}} inside the f-string so the bot filter is baked in at import time while the runtime value is filled in later:
QUERY_MAP = {
    "top_referrers":                  TOP_REFERRERS,
    "top_4xx_errors":                 TOP_4XX_ERRORS,
    "top_articles":                   TOP_ARTICLES,
    "traffic_metrics":                TRAFFIC_METRICS,
    "geo_location_analysis":          GEO_LOCATION_ANALYSIS,
    "page_visitors":                  PAGE_VISITORS,
    "reader_retention":               READER_RETENTION,
    "hourly_traffic_pattern":         HOURLY_TRAFFIC_PATTERN,
    "referrer_to_article_conversion": REFERRER_TO_ARTICLE_CONVERSION,
    "daily_visitor_trend":            DAILY_VISITOR_TREND,
    "new_vs_returning":               NEW_VS_RETURNING,
}
The query map gives the agent layer a stable interface for fetching SQL by capability name.
tools/athena.py
The Athena execution helper. It:
- submits SQL to Athena
- polls until the query completes
- fetches the result set
- converts rows into dictionaries
def run_athena_query(sql: str, max_rows: int = 100):
    response = athena.start_query_execution(
        QueryString=sql,
        QueryExecutionContext={"Database": ATHENA_DATABASE},
        WorkGroup=ATHENA_WORKGROUP,
        ResultConfiguration={"OutputLocation": ATHENA_OUTPUT_LOCATION},
    )

    query_execution_id = response["QueryExecutionId"]
    ...
    return output
This is the execution boundary for the entire analytics flow. Everything else in the app depends on this helper returning clean tabular data.
models/nova.py
The model configuration file. It creates the Bedrock model used by the agent:
from strands.models import BedrockModel

model = BedrockModel(
    model_id="amazon.nova-lite-v1:0",
    region_name="us-east-1",
)
requirements.txt
The full Python dependency list for the app, including streamlit, boto3, and strands-agents.
Commands
python -m venv .venv
source .venv/bin/activate
pip install -r requirements.txt
streamlit run app.py
python main.py
Before shipping, it is also useful to verify nothing sensitive crept in:
git status
git diff --cached
gitleaks detect --no-banner --redact
Implementation Notes
A few design choices worth calling out:
- The assistant only calls Bedrock after the user submits a prompt — no background polling.
BOT_FILTERlives in one constant and is embedded via f-string into every query. Adding a new crawler pattern is a one-line change.- The
page_visitorsquery uses Python’s.format()for interpolation. The template uses escaped braces{{page}}inside the f-string so the bot filter is baked in at import time while the runtime value is filled in later. - The response-cleaning step strips
<thinking>tags before display so model reasoning never leaks into the UI. - Each tool has a focused docstring — this is what the model reads when deciding which tool to call, so precision matters.
Why Not Just Use the CloudFront Dashboard?
Early on I questioned whether the agent was even justified. CloudFront’s built-in analytics gives you top pages, referrers, error rates, and geo breakdowns out of the box — no infra to maintain, no SQL, just a UI with time range selectors. That covers a lot of what I originally planned to build.
The answer was to stop duplicating the dashboard and focus on what it genuinely can’t answer: reader behaviour. Which visitors read more than one article in a sitting? What time of day do real readers show up — not crawlers, but people? Which referrer sources actually convert to article reads vs landing on the homepage and leaving? These questions require joining, filtering, grouping across sessions in ways the dashboard doesn’t expose. That’s where the agent earns its place.
The tools that overlap with CloudFront — geo breakdown, referrer counts, error rates — stayed in because they benefit from the bot and scanner filtering the agent applies, which the dashboard doesn’t do.
What’s Next
- On-the-fly query generation — right now every tool maps to a pre-written SQL string. The next step is letting the model generate Athena queries directly from the question, which would make the agent handle arbitrary traffic questions without needing a new tool for each one.
- Deploy to AWS — the agent currently runs on my Mac Mini at home. The plan is to host it on AWS under
oagent.sreevamsi.dev, with Amazon Cognito handling authentication so it is accessible from anywhere without being open to the public. The compute is still being evaluated — ECS, App Runner, and Lambda are all on the table.